
FEEDER
Emotional analytics SaaS applied to audiovisual content.

UX / UI / Visual Identity


My role in the project
Design of the entire user experience (UX) and visual interface (UI) of the platform. Definition of the information architecture and structuring of the analytics dashboard. Design of user flows, index systems, and data visualization, along with the creation of the design system, visual identity, and website design.
Feeder was born with the ambition to become a reference platform for the emotional analysis of audiovisual content, aimed at marketing, product, and creative teams who needed to understand something that, until then, was difficult to measure: how an audience actually reacts while consuming a video.
The proposal was built on two fundamental ideas: on one hand, advanced analytical capabilities based on facial recognition technology and machine learning, capable of transforming micro-expressions into qualitative metrics related to attention, validation, impact, and engagement.
On the other, real operational accessibility, allowing non-technical profiles—marketing managers, creatives, or planners—to interpret complex results and use them in their daily work without needing knowledge in neuroscience or data analysis.
The design challenge lay in translating a highly complex and abstract technology—emotions, unconscious reactions—into a clear, structured, and actionable analytics tool, avoiding two common issues in these types of products: excessively technical and unreadable dashboards, or simplifications that dilute the real value of the data.
From capture to data
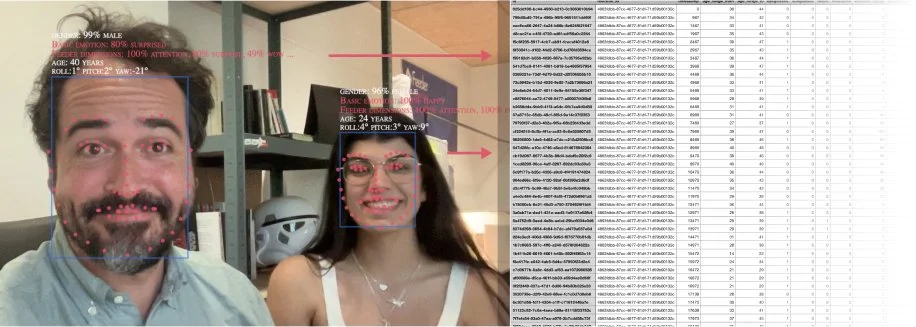
Before the results reach the dashboard, Feeder had to solve a highly complex prior problem: capturing biometric signals in uncontrolled environments and transforming them into usable data.
The system is based on facial recognition algorithms capable of identifying key facial points, detecting micro-expressions, and associating them with emotional dimensions such as validation, impact, or engagement through proprietary algorithms. All of this must work in real-time, across different lighting conditions, devices, and user profiles.
From a product standpoint, the challenge was not only technical but also one of translation: converting large volumes of raw data—coordinates, probabilities, timestamps—into structured and reliable information, prepared for later analysis by non-technical profiles.
This invisible layer of data processing and normalization is the foundation upon which the entire Feeder Metrics experience is built: without it, the indices, graphs, and the ability to consistently compare audiences or campaigns would not exist.
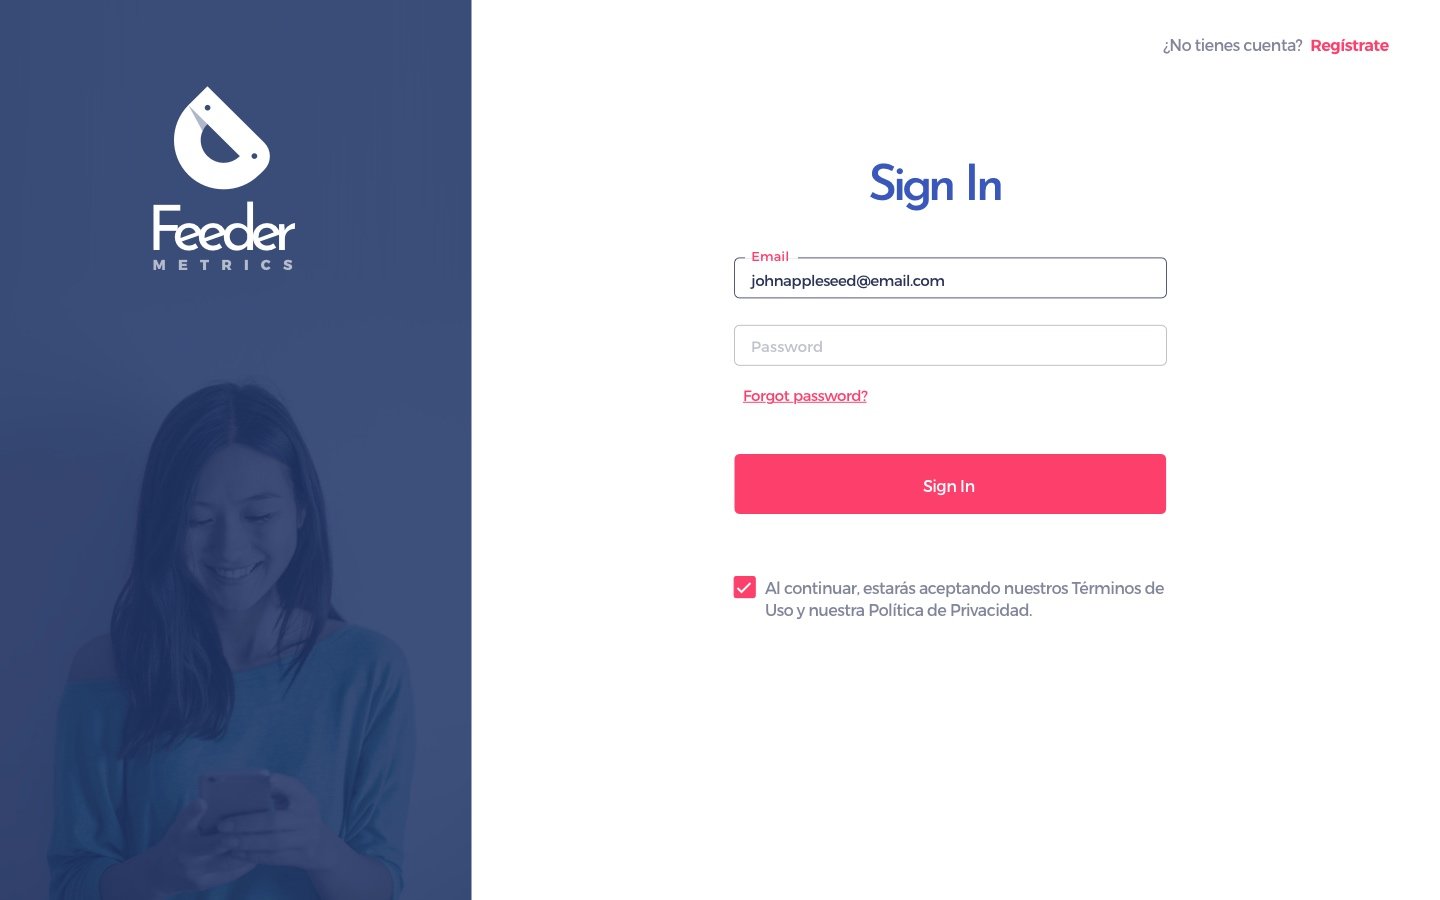
ACCESS AND CAMPAIGN MANAGEMENT
Before accessing the emotional analysis, Feeder incorporates an access, creation, and campaign management layer designed to organize work and facilitate the continuous use of the platform.
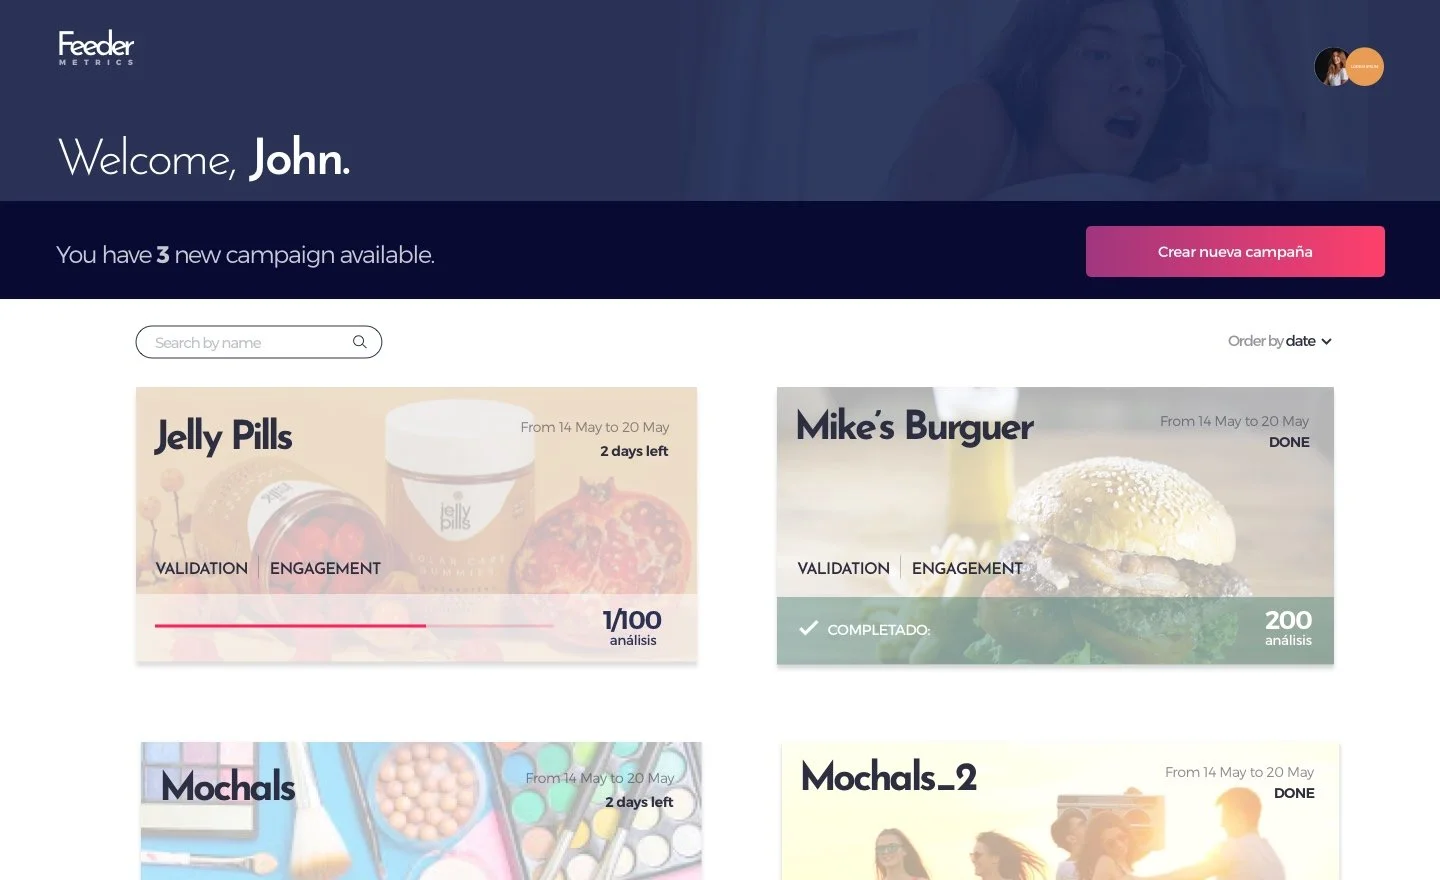
This view functions as the product's control point, allowing users to manage campaigns, create new projects, and access results from a single space, without friction or information overload.
From a UX perspective, this layer achieves several key objectives:
Clear control over the status of each campaign, differentiating between active, ongoing, or completed projects.
Agility in accessing analysis, reducing the leap between management and result reading.
Ease of creating new campaigns, with visible and predictable actions that encourage iteration and recurring use.
Scalability of use, allowing for work with multiple projects or clients without losing orientation or context.
Each campaign is presented as an autonomous unit, providing just enough information to understand its status before diving into the details, thus avoiding the exposure of complex data at a stage where it is not yet necessary.
This approach allows marketing, product, and creative profiles to maintain an operational view of the work in progress, manage their accounts autonomously, and save deep analysis for the appropriate moment.
Emotional Analysis
The design started from a very clear premise: not to design a tool for observing data, but a tool for making decisions.
This meant structuring the experience so that the user could move from a quick executive reading to a deep analysis without losing context or coherence at any point in the journey.
INFORMATION ARCHITECTURE
The platform was organized into different reading levels, designed to accompany the user's reasoning naturally.
The first level is the overview, an executive view aimed at quickly answering the key question: does this content work or not? Here, aggregated indices and global ratings are presented, allowing for a glance-based comparison of pieces, versions, or campaigns.
Once the general result is understood, the user can access the dimensional analysis, where it is possible to delve into specific dimensions —attention, validation, engagement, impact, or specific emotions— to understand why that result was obtained.
Finally, the segmentation and context layer allows for analyzing metrics by demographic groups, such as age or gender, avoiding decisions based solely on averages and facilitating the detection of divergent behaviors among audiences.
This hierarchy reduces the initial cognitive load and prevents analysis paralysis by excess information, guiding the user from the general to the specific in a progressive manner.
SYSTEM OF INDICES AND GLOBAL RATING
One of the main UX challenges was transforming millions of biometric signals into indicators that are both understandable and comparable.
To address this, an aggregated index system was designed to function as a true thermometer of content performance.
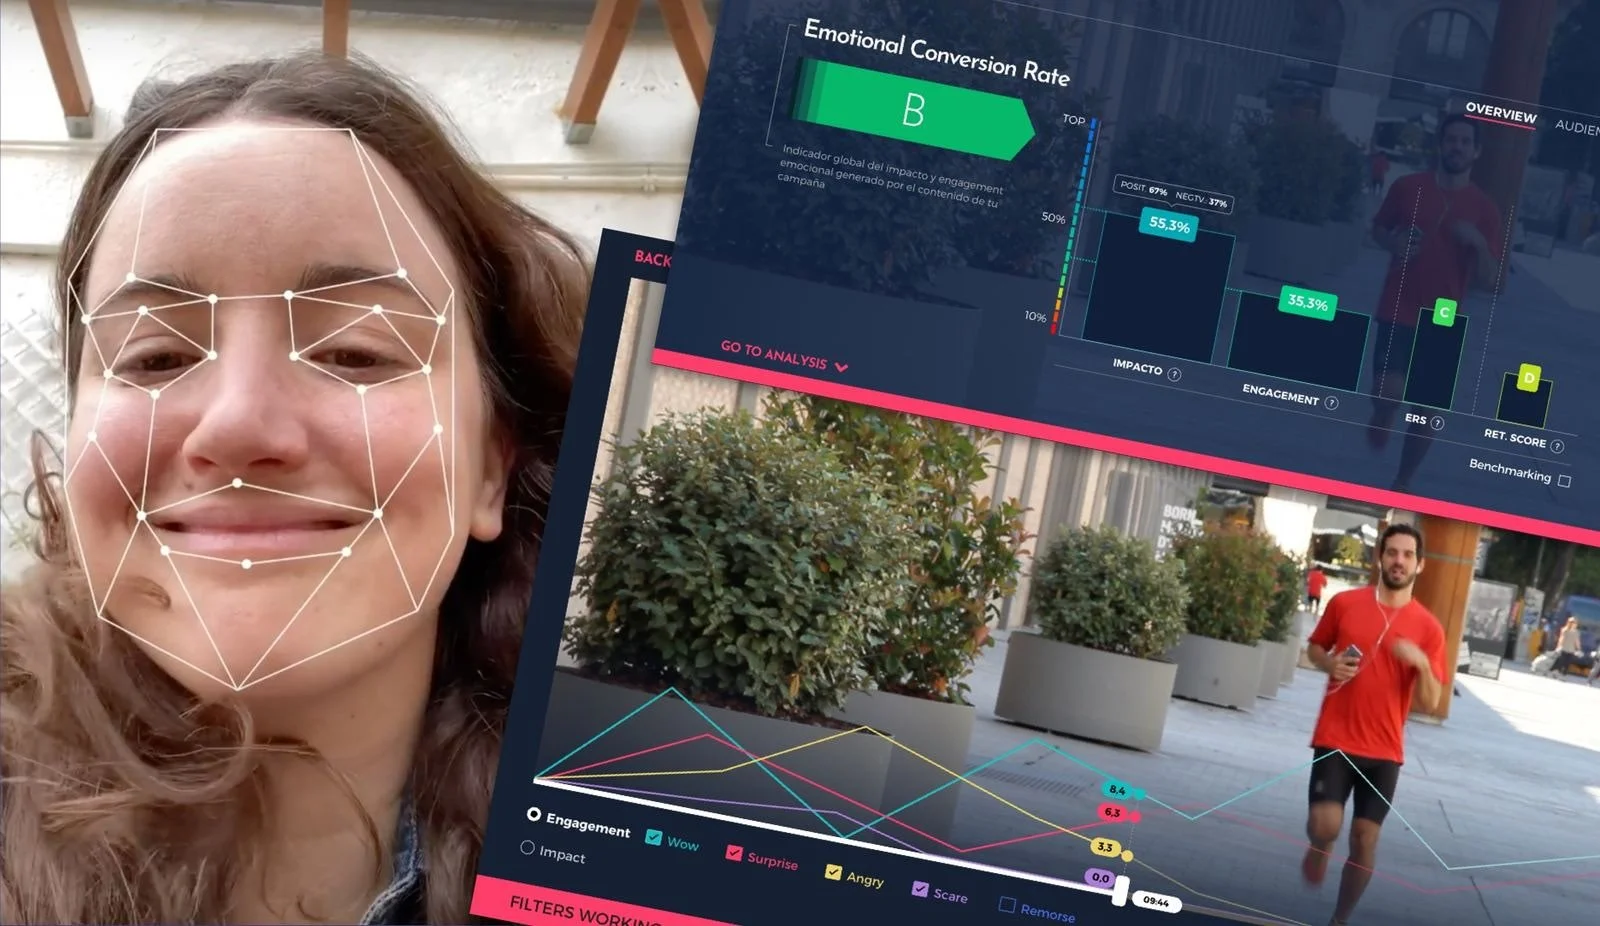
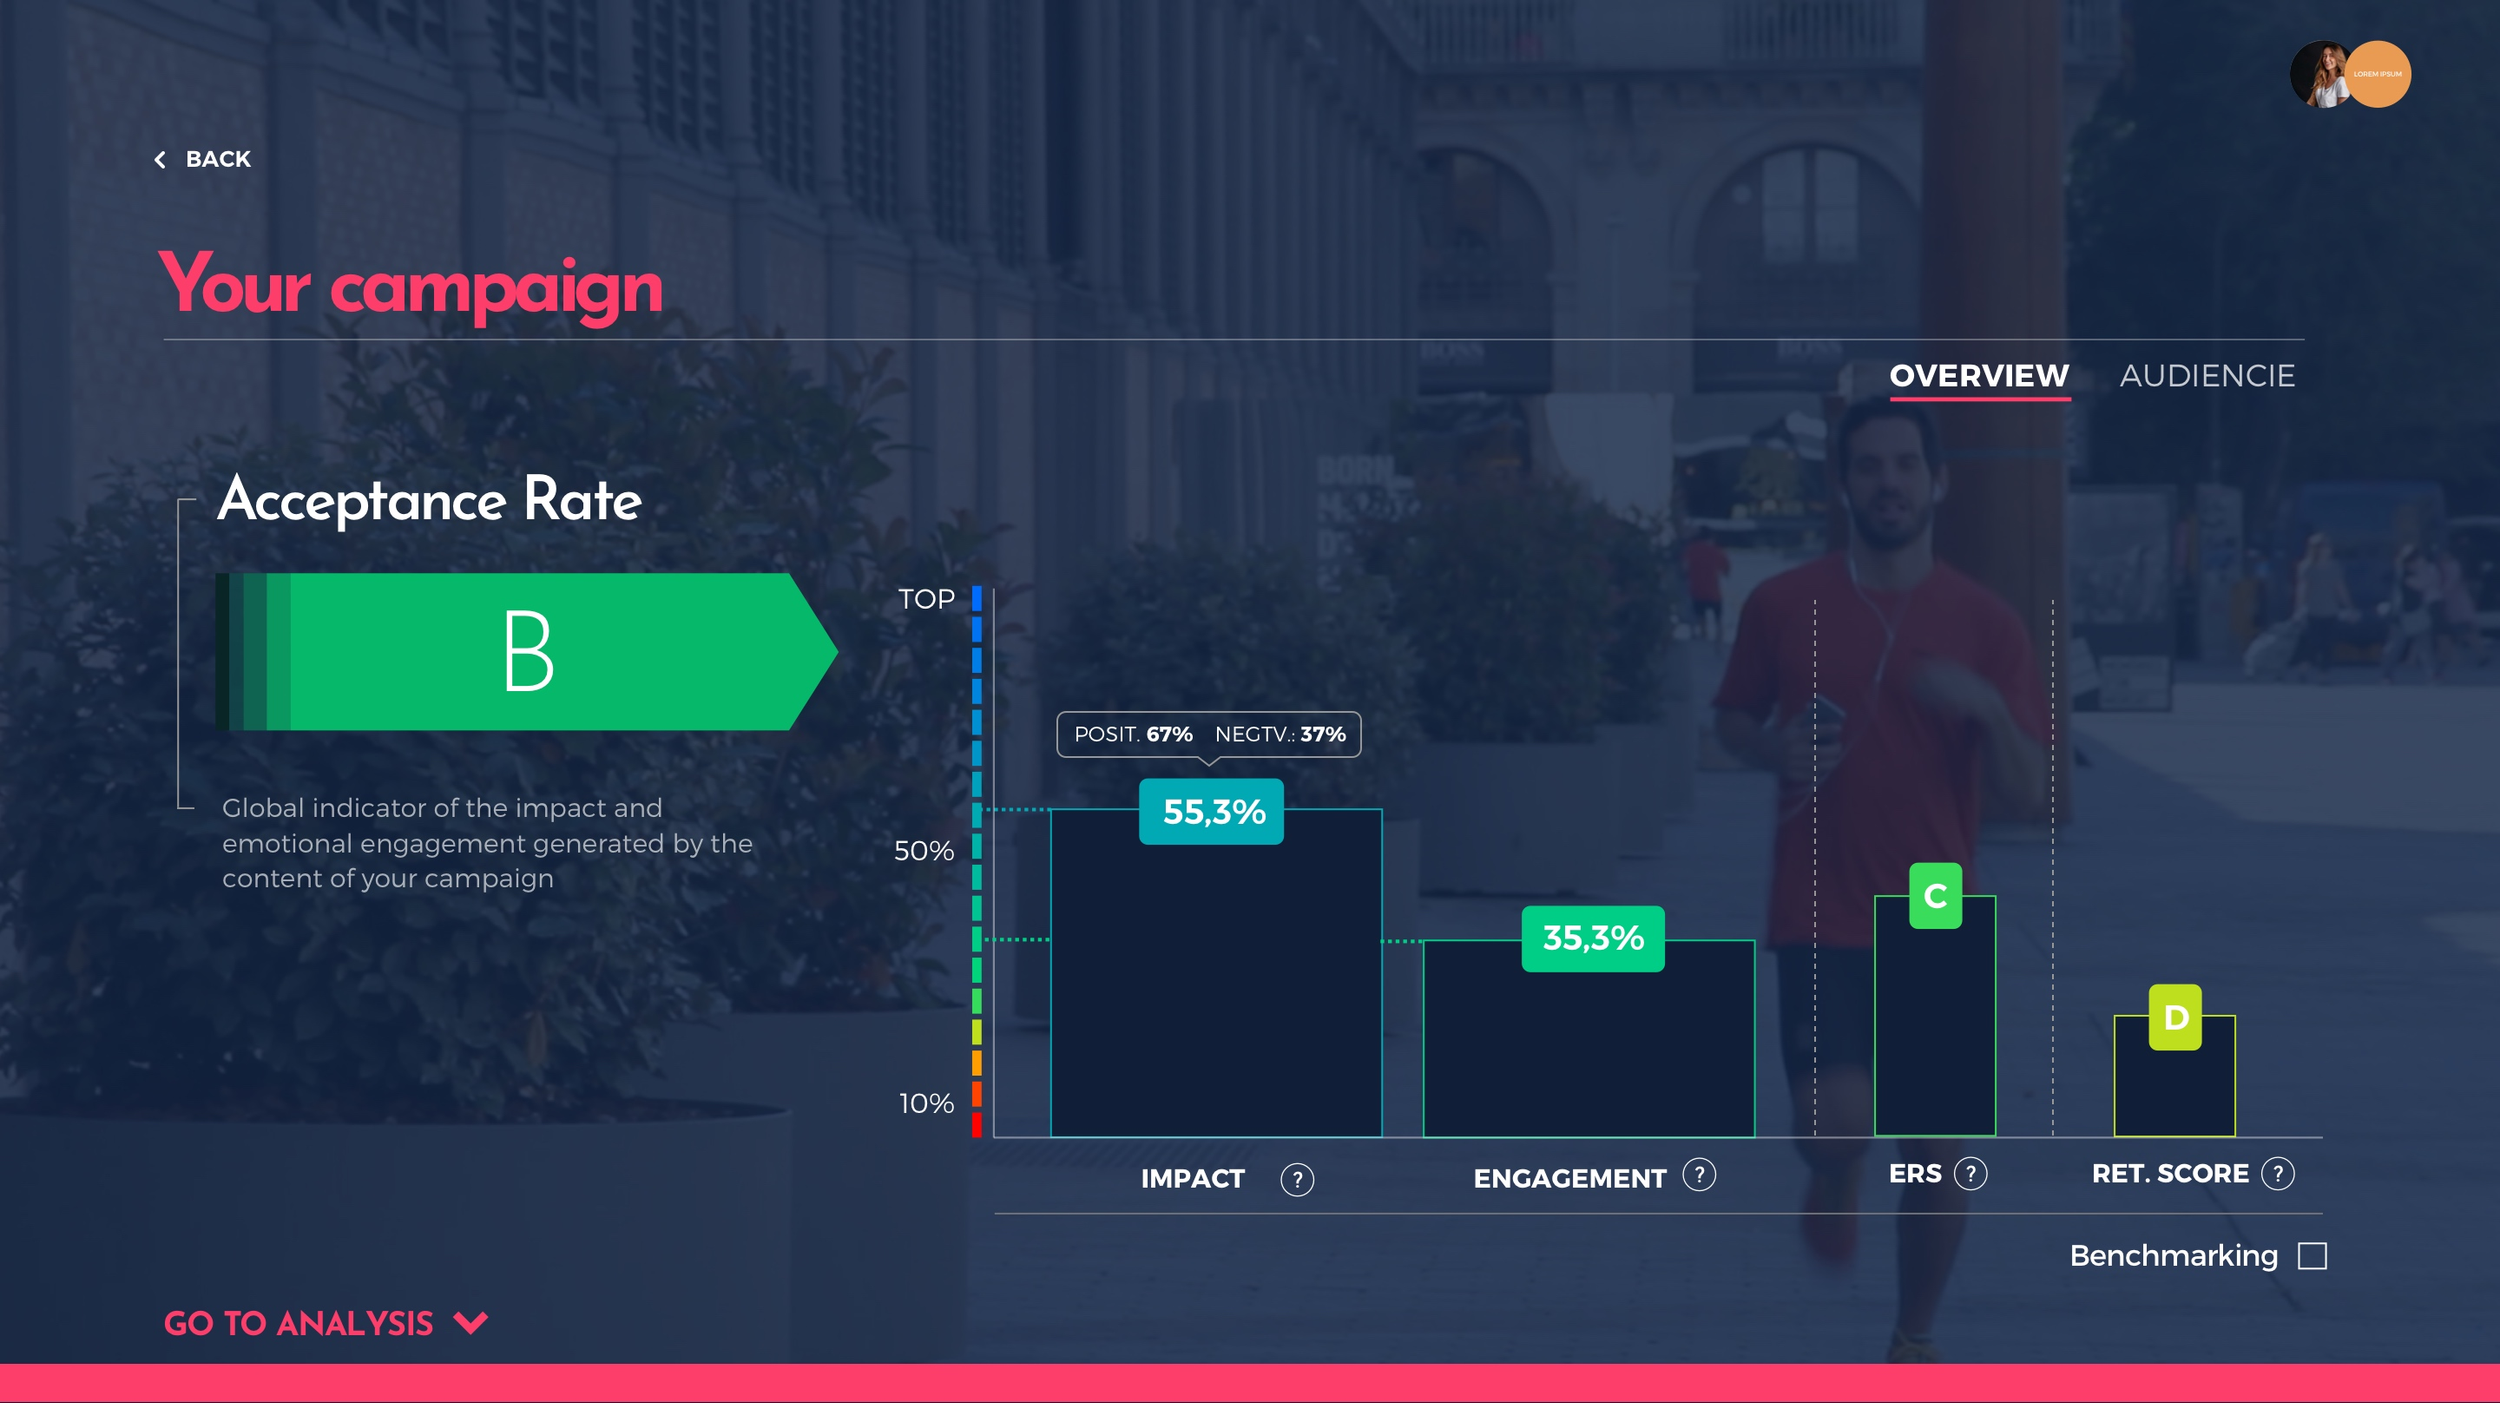
In the overview view, the dashboard presents a global performance assessment articulated through the Acceptance Rate, which acts as the primary indicator of the audience’s emotional response to the piece.
This value synthesizes the balance between positive and negative reactions and is supported by a comparative reading of key indices, displayed visually and hierarchically:
Impact, which measures the content’s ability to generate meaningful peaks of emotional reaction.
Engagement, which reflects the level of sustained emotional connection throughout the video.
ERS (Emotional Response Score), an aggregated indicator of the overall emotional response, useful for consistently comparing different pieces.
Retention Score, linked to the content’s ability to maintain attention and prevent progressive user drop-off during playback.
The combination of these indicators enables a clear and actionable reading in just a few seconds, while also providing a natural entry point into a more detailed, time-based analysis of each dimension.
TEMPORAL AND DIMENSIONAL ANALYSIS
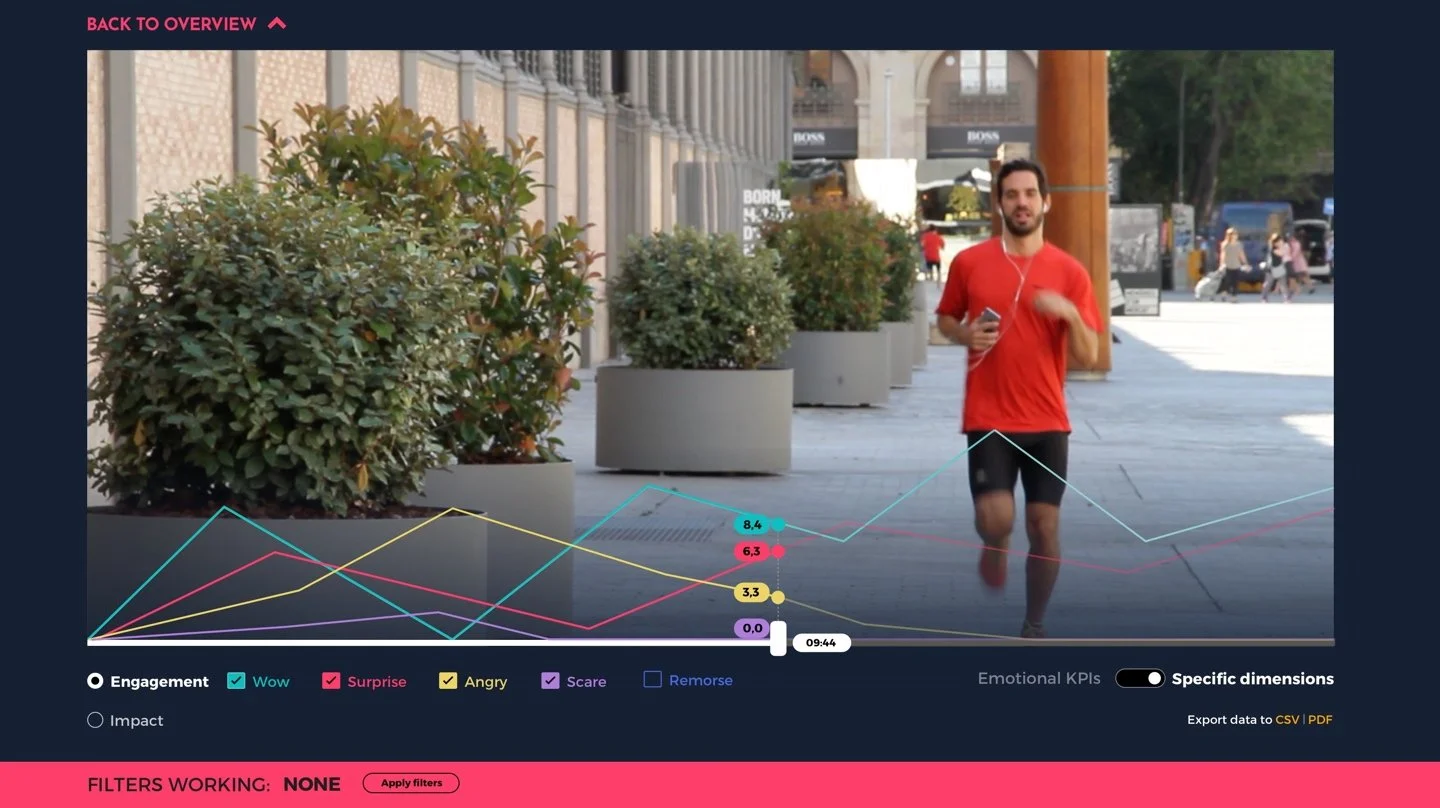
The dashboard also allows analysis of how each dimension evolves over the duration of the video.
From a UX design perspective, priority was given to a clear reading of variations, making it easier to identify peaks, drops, and relevant changes, as well as establishing a direct relationship between data and content, so users can associate a specific variation with a precise moment in the piece.
Comparability across dimensions is maintained within a single visual framework, allowing different behaviors to be evaluated without changing context or relearning the interface.
This approach is particularly useful for detecting points of attention loss, moments of high impact, or segments that generate rejection or neutrality.
SEGMENTATION AND COMPARATIVE ANALYSIS
The dashboard incorporates segmentation capabilities that make it possible to analyze how different audience groups react to the same content.
From a UX standpoint, special care was taken to ensure that these filters are visible and consistent, accessible from any analysis view, and applied without altering the overall reading structure.
Metrics are presented in a comparable way across segments, maintaining the same index and dimensional logic. This reduces cognitive friction and enables clear conclusions even as data volume increases.
As a result, it is possible to quickly identify whether content performs particularly well for a specific target, generates polarized responses, or loses effectiveness outside the core audience.
INFORMATION DENSITY AND VISUAL COHERENCE
Each screen is structured into clearly defined blocks, where primary metrics carry greater visual weight and secondary information remains accessible without competing for attention. Color usage is kept under control, reserved for indicating states, variations, and validation levels.
Given the analytical nature of the product, particular attention was paid to information density.
Generous use of negative space helps prevent visual saturation, consistent alignments facilitate comparison between metrics, and unnecessary decorative elements were removed.
The goal was to support long analysis sessions without visual fatigue, while maintaining clarity and user control at all times.
The UI system was also designed with scalability in mind: reusable components for indices, charts, and segmentation; clearly defined states (positive, neutral, negative, alert); and visual consistency across overview, analysis, and comparison views. This made it possible to introduce new metrics and dimensions without breaking the existing mental model.
FINAL NOTE
The result is an emotional analytics dashboard that successfully translates a complex AI system into a comprehensible, structured, and decision-oriented tool. Its goal is to enable brands and creative teams to understand how their audience feels, precisely identify what works and what does not within an audiovisual piece, and optimize content with greater confidence before scaling investment.
Visual identity
Regarding Feeder’s visual identity, several conceptual directions were initially explored, each with a different approach but all aiming to represent the foundational principles of the platform (therefore becoming design requirements).
On one hand, the user’s reaction to audiovisual content being delivered; on the other, facial and emotional recognition, which form the basis of the analysis of that reaction.
Additionally, conveying positive connotations such as approachability and trust was particularly important, given that topics related to facial and emotional recognition—being relatively new and inherently complex—still generate some degree of controversy today, albeit increasingly less so.

With these premises established, the next step was to explore how these requirements could be unified into a single visual concept. In terms of “flow,” that is, how the platform itself operates, the process consists of a user receiving audiovisual content and sending their reaction back, captured through facial emotion recognition.
To represent this facial recognition at the core of Feeder, the most obvious solution was the use of a face—treated almost symbolically—and one that conveyed positive traits (most clearly, a smiling or laughing expression).
After numerous iterations, I decided to use the process itself as the basis for the structure. Users (represented as circles) take the role of the eyes in a hypothetical face, while the reaction line, when curved, resembles a smile.
In this way, Feeder’s functionality becomes implicitly embedded in the symbol: a basic representation of a face combined with the intended positive connotations.

The logo was then rotated 45 degrees, so that the straightest and most direct arrow—representing the delivery of content to the user—also aligned with physical logic, following the direction of gravity, as if “falling,” while still retaining the facial interpretation.
Once this concept was defined, the next design phase focused on creating the structural framework of the figure, integrating the structure and flow in a visually engaging and communicative way.

With this base established, the work shifted toward visual refinement: proportions, ratios, sizes, shadows, typography, vertical and horizontal structures, and finally the creation of a complete visual language aligned with what the logo aimed to convey—vibrant colors, dynamic forms, strength, and confidence.
The result is both a logo and a visual identity that convey all the required values, ideas, and concepts, are easily reproducible across different contexts, and reinforce the intended message through a coherent visual language.

It is also worth noting that because the “flow” is implicitly integrated into the logo itself, it allows for animations that visually demonstrate the core functioning of the platform.
Feeder App
Conceptualization and design from scratch.


Website
Regarding the website, the goal was logically to maintain consistency with the visual identity and design language already established.
At the messaging and content level, the focus was placed on Feeder Metrics, the platform/dashboard responsible for managing and visualizing the emotional analysis provided by Feeder.
For the upper section of the site—the header—I divided it into two levels, initially displaying only the top layer while keeping the second hidden. This way, upon arrival, the user first sees the image of a surprised woman looking at content on her phone, followed by Feeder’s tagline: “Don’t act, React.”
As the user scrolls down, the emotion expressed by the woman is no longer linked to the content she is watching, but to Feeder itself. To achieve this, a parallax effect is introduced and, through Feeder’s visual language, a landscape is revealed that conveys two ideas: on one hand, a futuristic aesthetic representing Feeder as “the future of facial recognition in marketing,” and on the other, a horizon that fades into the distance, symbolizing the vast new field of possibilities being opened up—subtly reinforced by mountains formed using the tool’s own chart graphics.
Throughout the website, animations, parallax effects, and graphic elements are used selectively and intentionally, always to reinforce the message of each section and enhance its communicative strength. In contrast, textual sections are designed to be extremely clear and minimalist, with generous negative space to prioritize readability and to balance the vibrant colors and energetic forms of Feeder’s visual identity.
